
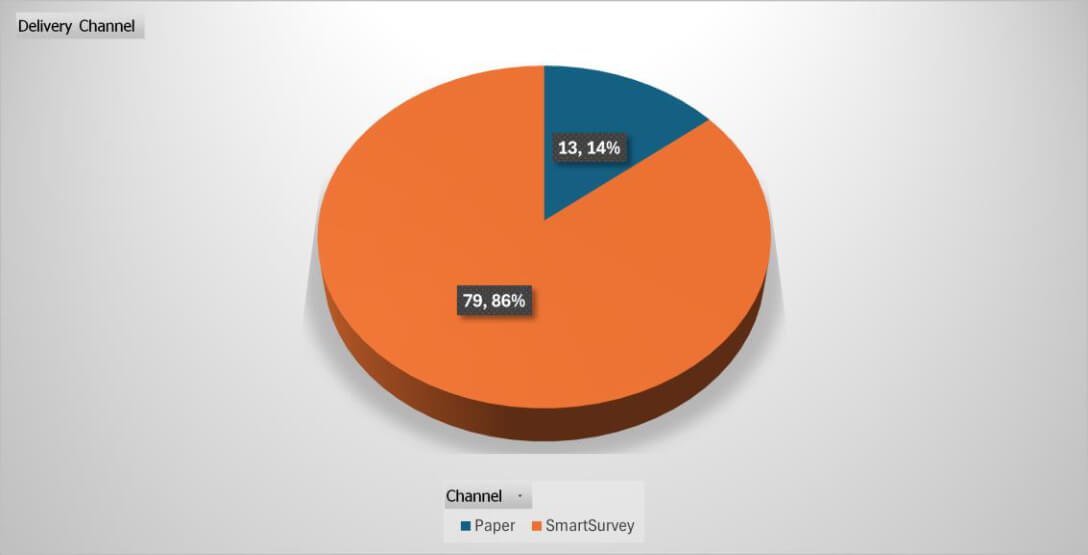



The recorded survey response rate of 52% is very good. 92 of the 174 clients responded. A hybrid strategy was taken in conducting the survey to ensure diversity and inclusivity.
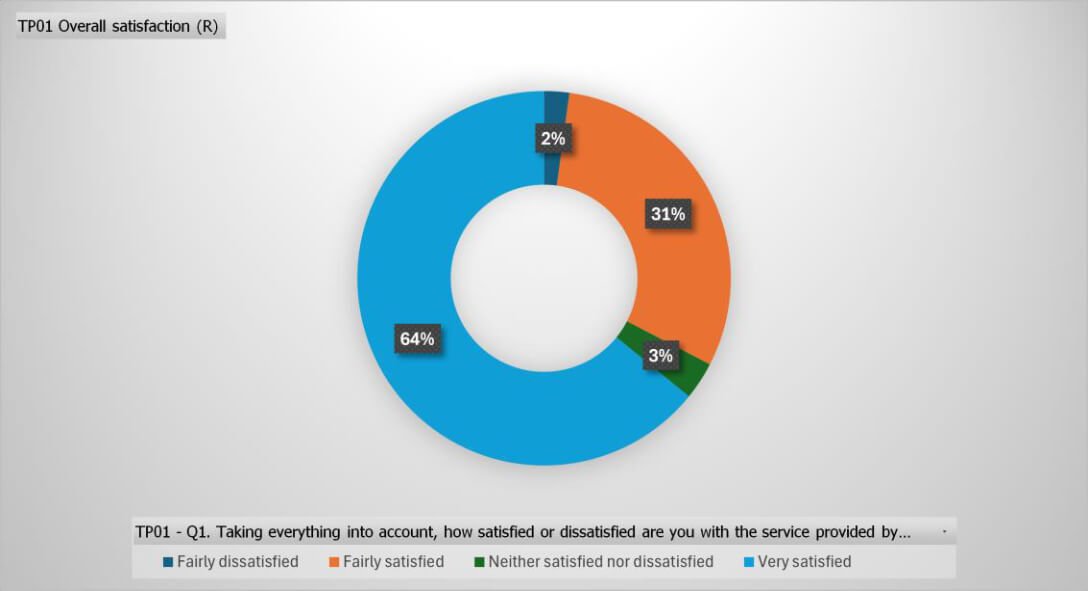
Approximately 97% of survey respondents expressed somewhat satisfaction with the overall quality of services provided by QVT. A significant percentage (89%) of respondents had repairs carried out within the reporting period. These indicate a positive representation of clients for the TSM survey, highlighting the organization’s commitment to meeting client needs.
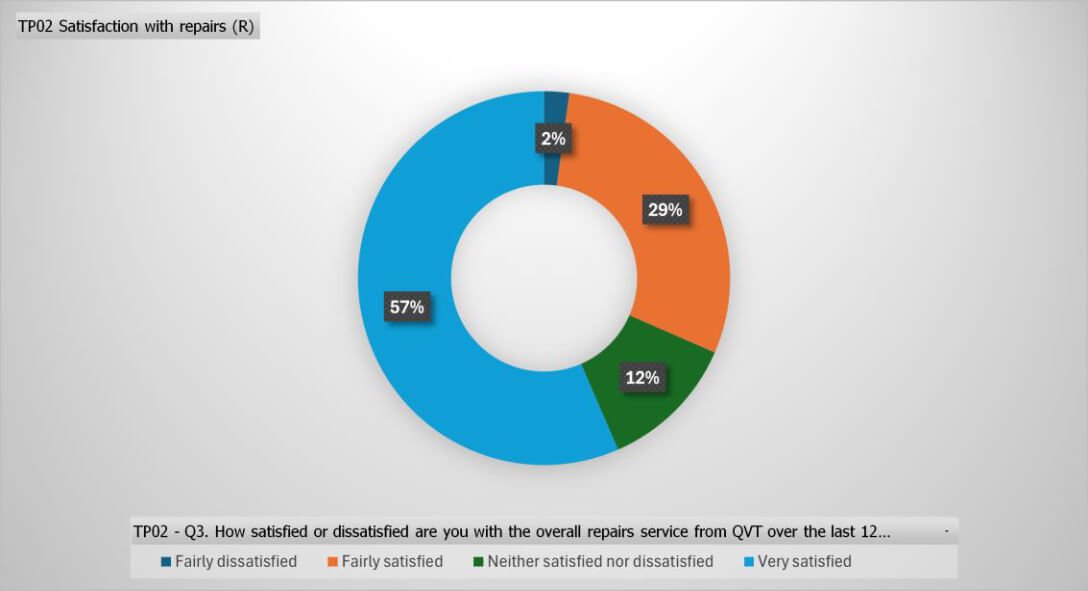
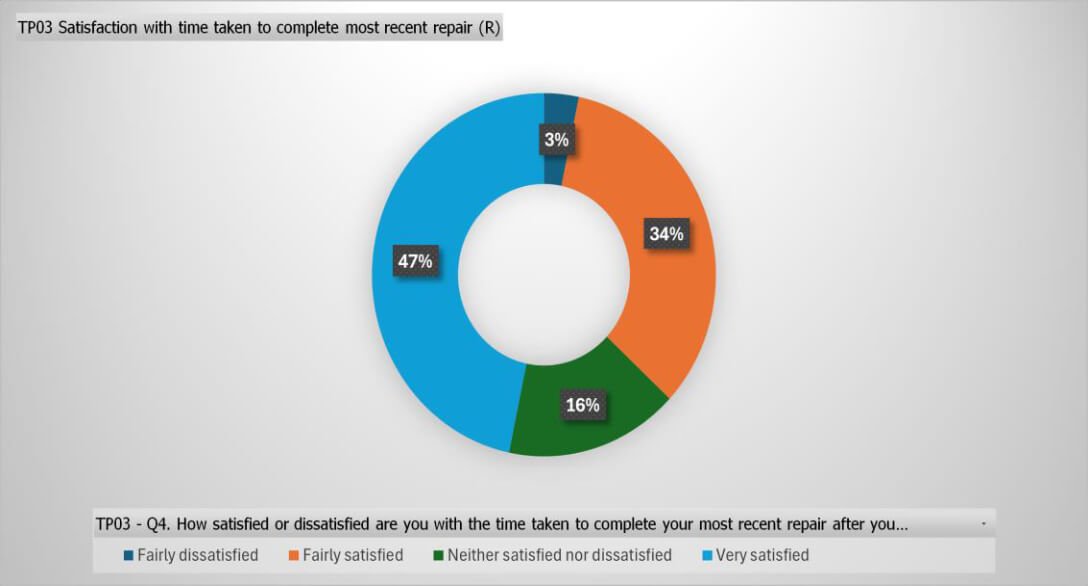
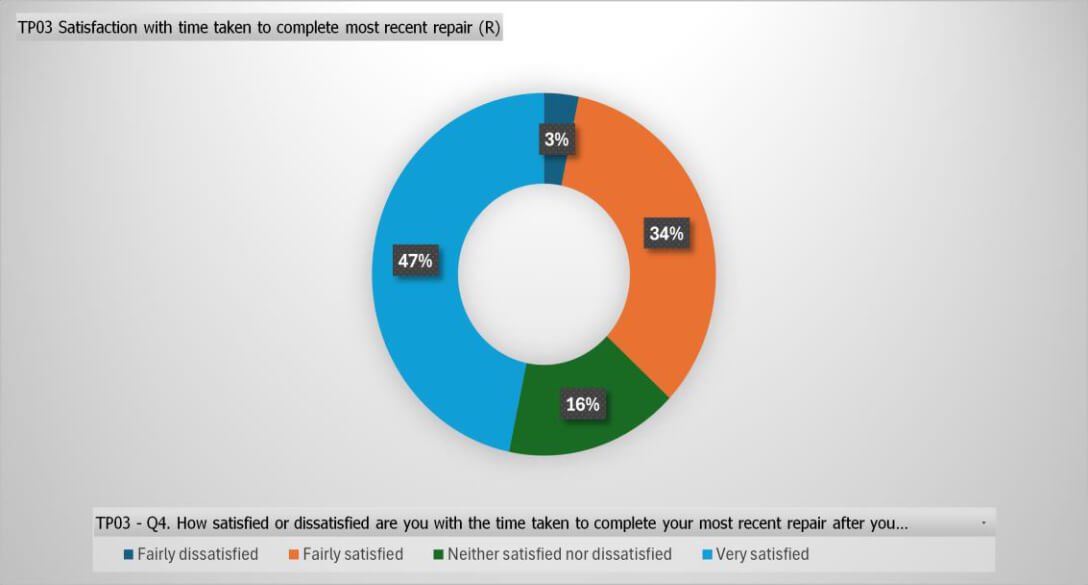
2% of respondents were dissatisfied with the way the repairs turned out while 97% expressed overall satisfaction with the repairs. In addition, 3% were dissatisfied with the amount of time it took to complete the repairs. Interestingly, these findings align with the earlier result where 3% of respondents expressed dissatisfaction with the overall QVT services. The majority of respondents, 97%, were content with the repairs.
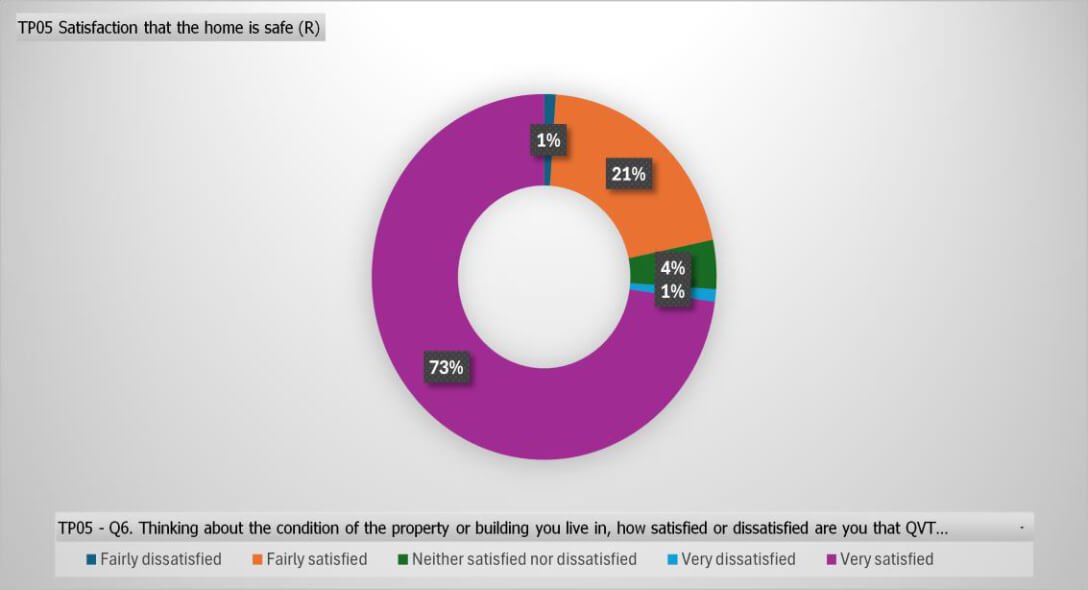
98% of respondents expressed happy about home safety. somewhat satisfaction with the safety of their homes while a minority (2%) had concerns 97% of respondents were with the time it took to complete their most recent repairs while 3% were not satisfied with the repair completion time. These results highlight the overall positive sentiment regarding home safety and repair services, with only a small percentage expressing dissatisfaction.
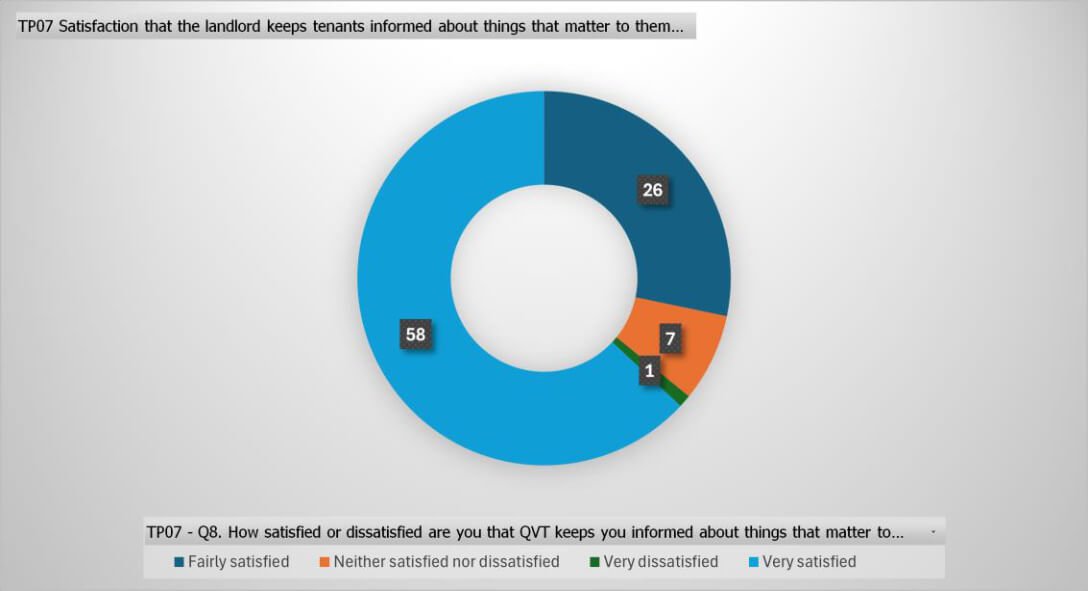
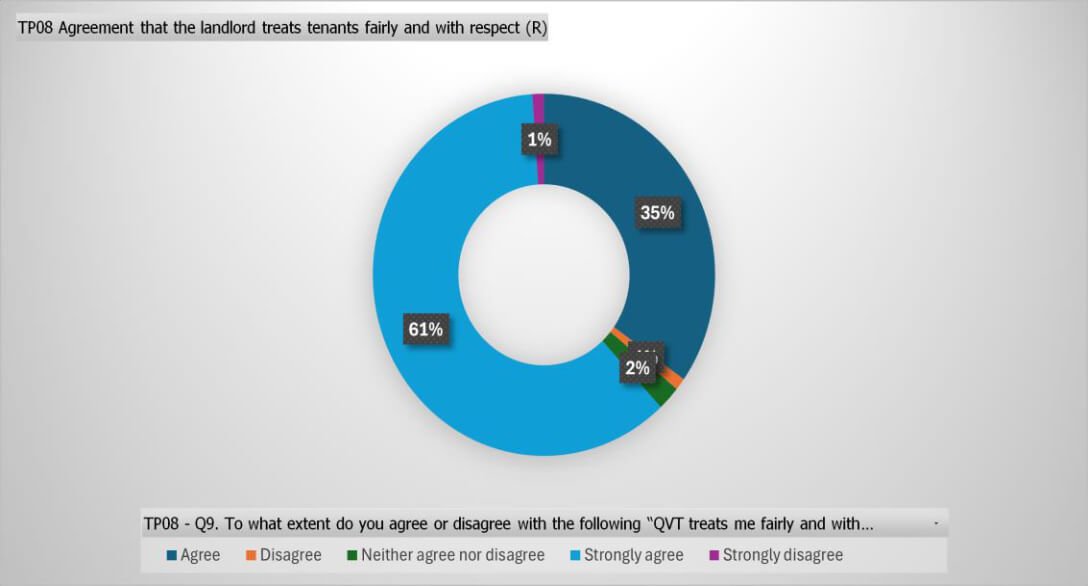
Among the respondents, 99% expressed somewhat satisfaction with QVT’s communication regarding matters relevant to them. However, 3% of clients reported feeling that QVT does not treat them fairly and respectfully. It’s essential for the organisation to address this concern and ensure consistent positive interactions with all clients.
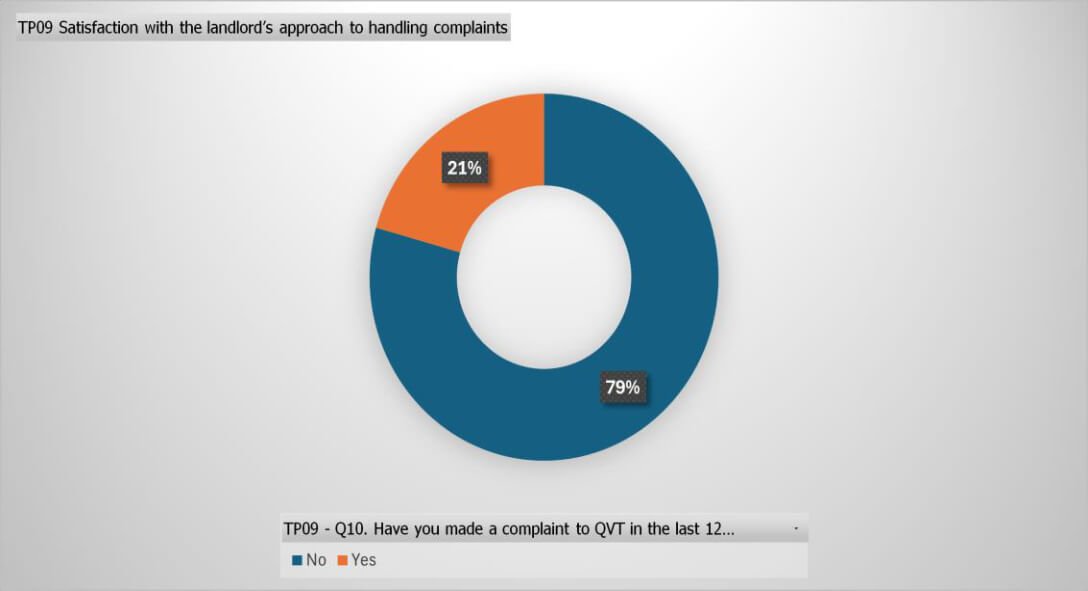
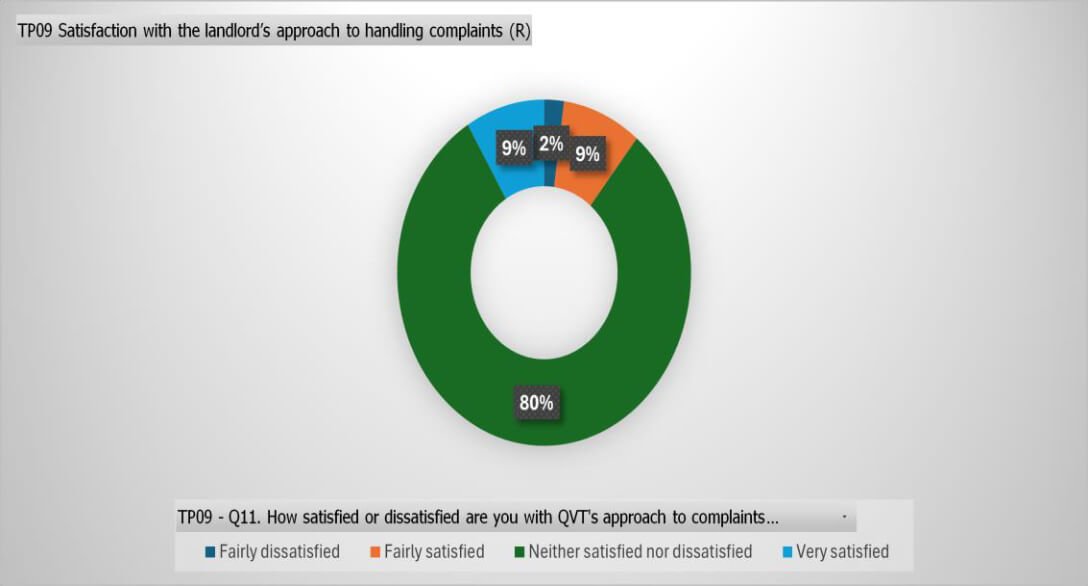
Among the survey respondents, 21% had filed complaints, and 9% of them expressed fair dissatisfaction with QVT’s complaint-handling approach. Interestingly, the remaining 79%, who had not lodged complaints during the reporting period, likely indicate satisfaction with QVT services, consistent with previous findings.
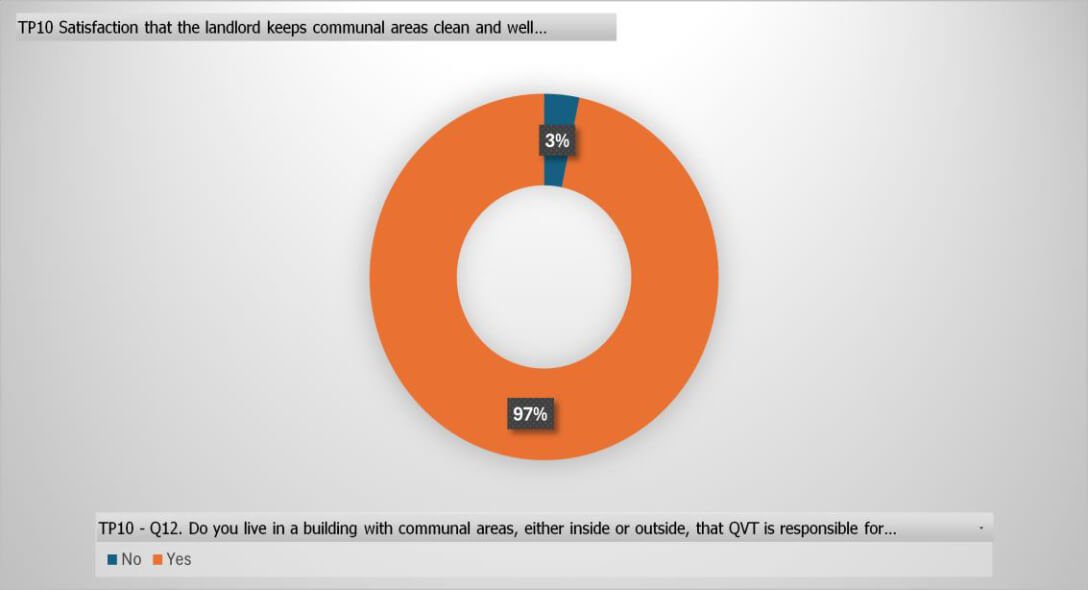
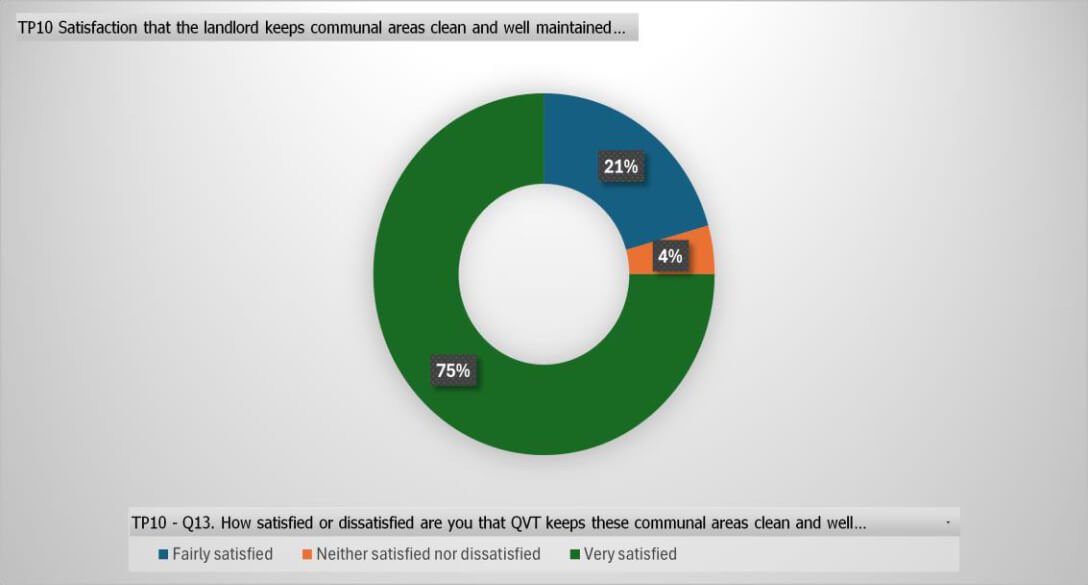
The feedback from respondents highlights the dedicated efforts of QVT in upkeeping clean and well-maintained communal areas. This commitment to enhancing the neighbourhood environment is commendable and contributes to a positive living experience for residents.
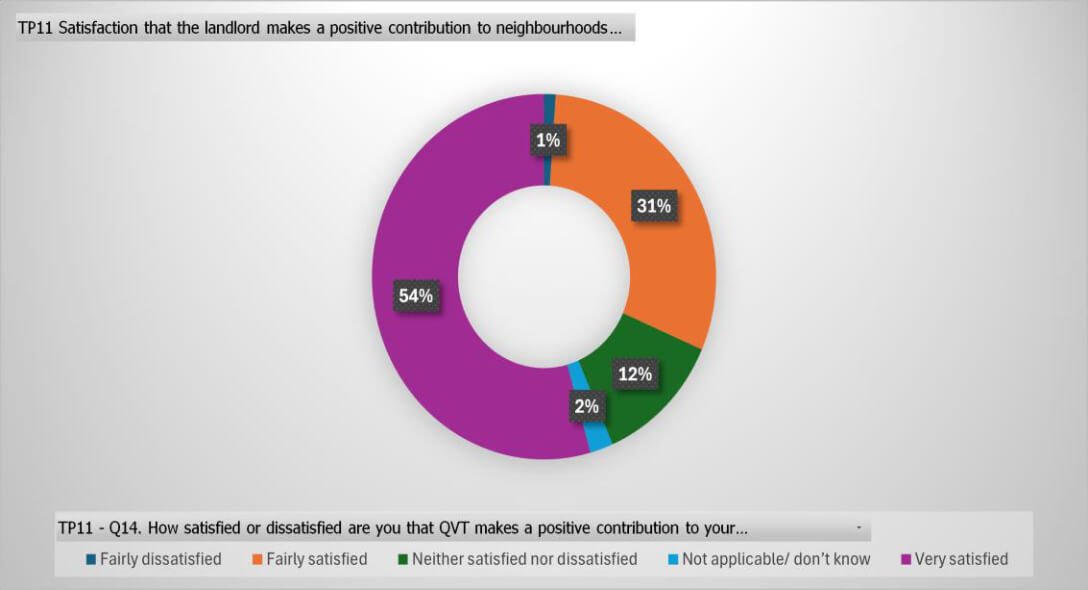
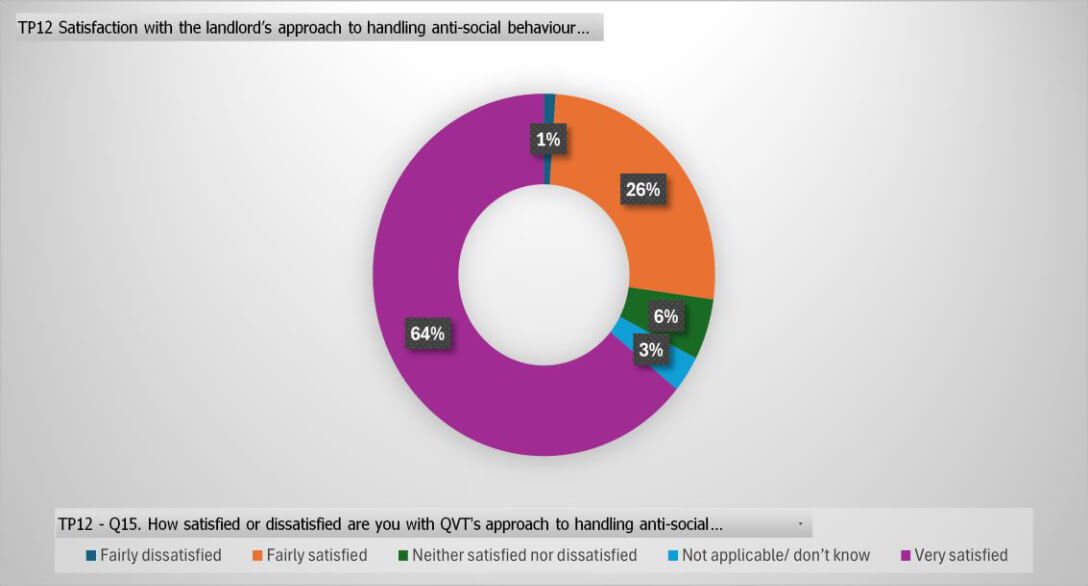
Only 1% expressed dissatisfaction with QVT’s contribution to the neighbourhood and handling of anti-social behaviour (ASB). Similarly, a comparable percentage believes that these performance metrics are either not applicable or unreportable. However, its essential to note that these numbers are insignificant when compared to the majority who reported positively on QVT’s contributions to the neighbourhood and management of anti-social behaviour.
These findings demonstrate overall positive sentiment, with minor areas for improvement.